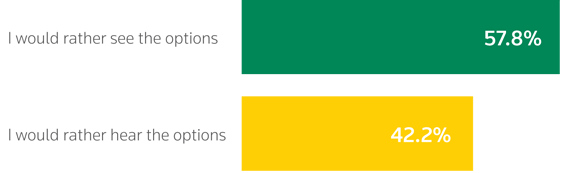
When Asked:
When calling Customer Service would you rather Hear the menu choices or See them on your smart phone/tablet/computer?
Source: Customer Service See or Hear Consumer Survey
And More:
- In a typical month, 88% of people have at least one interaction with customer service.
- 81% of consumers prefer to speak to a live agent, but dislike IVRs and long hold times. Consumers are most frustrated with IVRs when they need to repeat all their information.
- 47% of Consumers’ perception is positively affected when several connectivity options are provided.
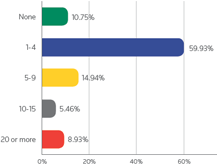
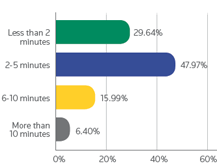
- 30% of consumers agree to be “on hold” less than 2 minutes before hanging up.
- 33% if consumers are frustrated when the IVR has no option relevant to their problem.
- 76% of consumers notice a level of technology a company’s customer service center uses to interact with them.